Download the full presentation (PDF, in French)
At a glance
Context
- School project at IMT Atlantique, in 2025, in a team of 3.
- A project run by three people: each of us explored the data and built our own analyses, which we then pooled and consolidated into a final presentation.
- Open data on road traffic injury accidents (data.gouv.fr), combined with population data.
Actions
- Data preparation and merging with Power Query.
- Indicators built in DAX.
- Analysis along four lines: geography, men / women, accident-prone conditions, and an insurance case.
Results
- A reading of accidents that separates volume, risk relative to population, and severity.
- A minimum-risk profile identified for the insurance case.
Tools
- Power BI: visualisations and dashboards.
- Power Query: data preparation and merging.
- DAX: indicators.
Context
The goal was to understand where, when and under what conditions road traffic injury accidents happen in France, using open data from data.gouv.fr combined with population data.
Part of the project takes the point of view of an insurance company: identifying the population least exposed to serious accidents, in order to target an offer.
Approach
Data preparation
Accident and population data were prepared and merged with Power Query.
Indicators
Several indicators were built in DAX:
- accident rate per 100,000 inhabitants;
- severity rate;
- uninjured rate;
- calculated age groups.
Four lines of analysis
- Geographical distribution: regions and departments.
- Men / women comparison: involvement, severity and safety equipment.
- Accident-prone conditions: weather, lighting, road type, time of day and seasons, separating the number of accidents from their severity.
- Insurance case: identifying a minimum-risk profile with a decomposition tree.
Results
These results describe correlations observed in the data, not cause-and-effect relationships.
Geographical distribution
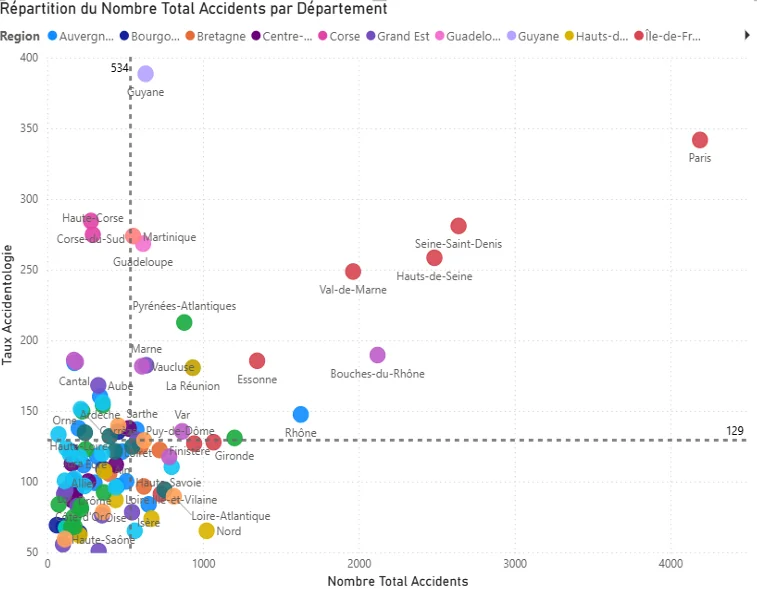
In absolute numbers, Île-de-France has the most accidents. Relative to population, French Guiana has the highest rate; other overseas territories and Corsica also stand out.
Men and women
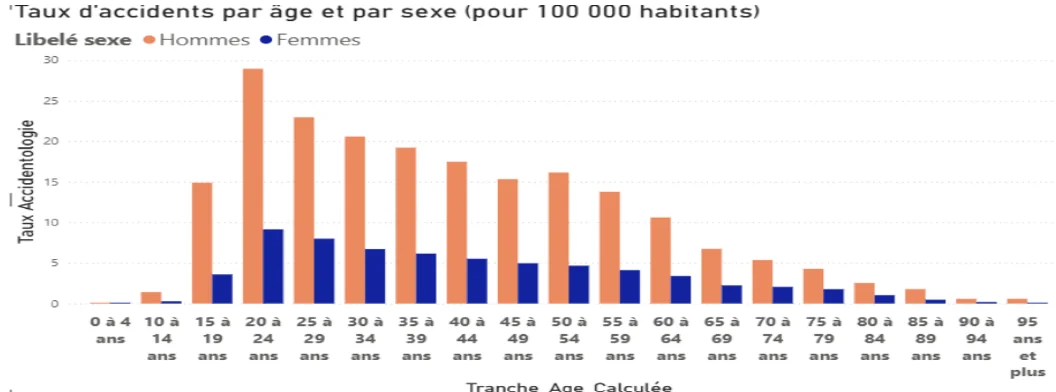
Men are more involved at every age, with more serious accidents on average. Women wear safety equipment more often, which may partly explain this gap.
Accident-prone conditions
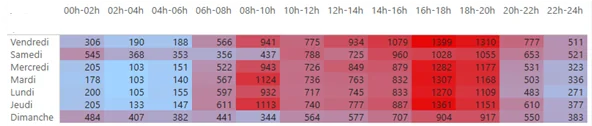
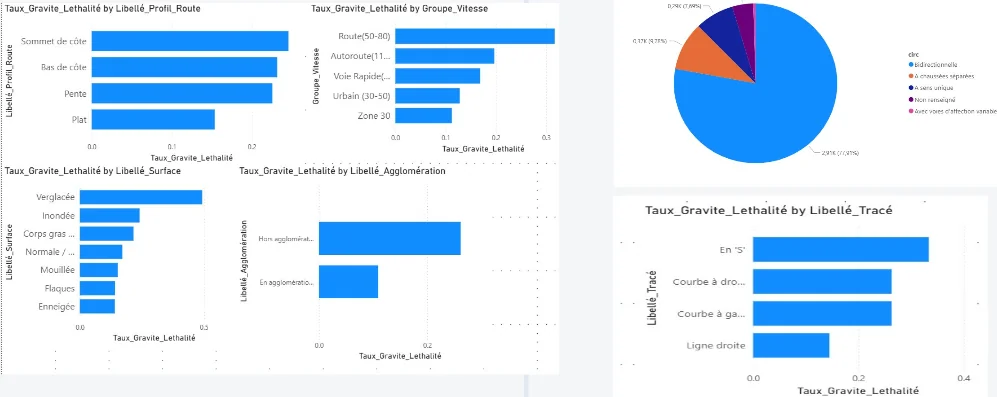
Accidents are most frequent in towns, on weekdays and at rush hour, but most serious outside built-up areas, at night without lighting, on bends and on icy roads.
Wearing a seat belt is associated with the highest uninjured rate, whatever the speed and the road.
Insurance case
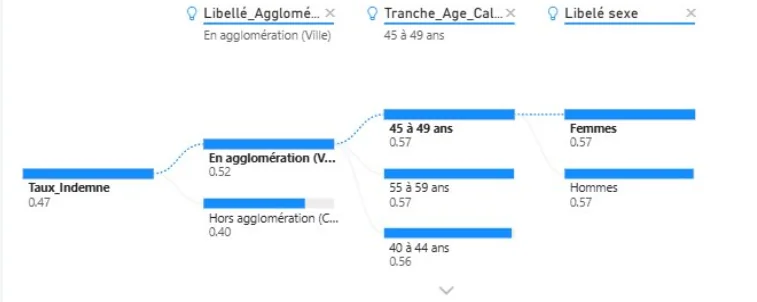
The profile with the highest uninjured rate is people aged 45 to 59 driving in built-up areas, men and women alike, with an uninjured rate of 0.57.
What I learned
- Relating figures to population changes the picture: the area with the most accidents is not the one where the risk is highest.
- Volume and severity tell two different stories, and they need to be analysed separately.
- Correlation is not causation: some results hide biases. For example, airbags seem less protective because they mostly deploy in the most violent crashes.
- An analysis is most valuable when it answers a concrete business question, such as targeting an insurance offer.