During the 2024-2025 academic year, five other IMT Atlantique students and I worked with the École Wushu in Brest to design a method for quantitatively assessing Tuishou movements, a two-person tai chi practice.
The goal was to build a framework for comparing the movements of an expert and a beginner, both visually and objectively, in order to identify differences in posture, rhythm and fluidity.
This project combined data visualisation, data analysis and user-centred design, within a rigorous project management approach.
At a glance
Context
- Commissioned by the École Wushu in Brest, from September to December 2024, in a team of six IMT Atlantique students.
- Need: quantitatively compare the tai chi movements of an expert and a beginner.
Actions
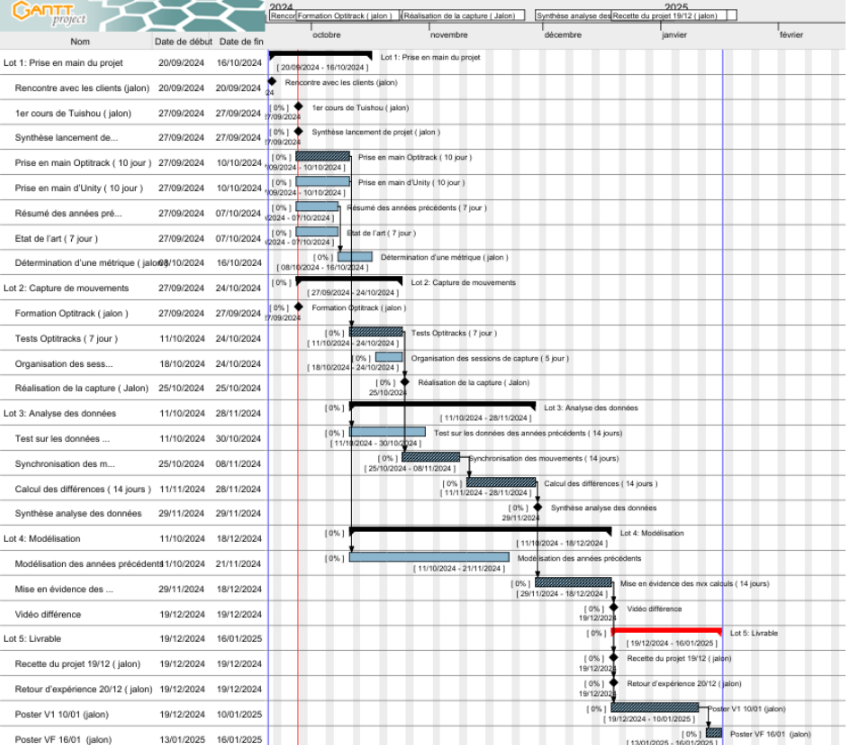
- Project management: Gantt chart, task tracking, risk analysis and action plan.
- Motion capture with OptiTrack.
- Data processing and modelling in Unity.
Results
- A data visualisation method for quantitatively comparing movements.
- A demonstration video approved by the client.
Poster
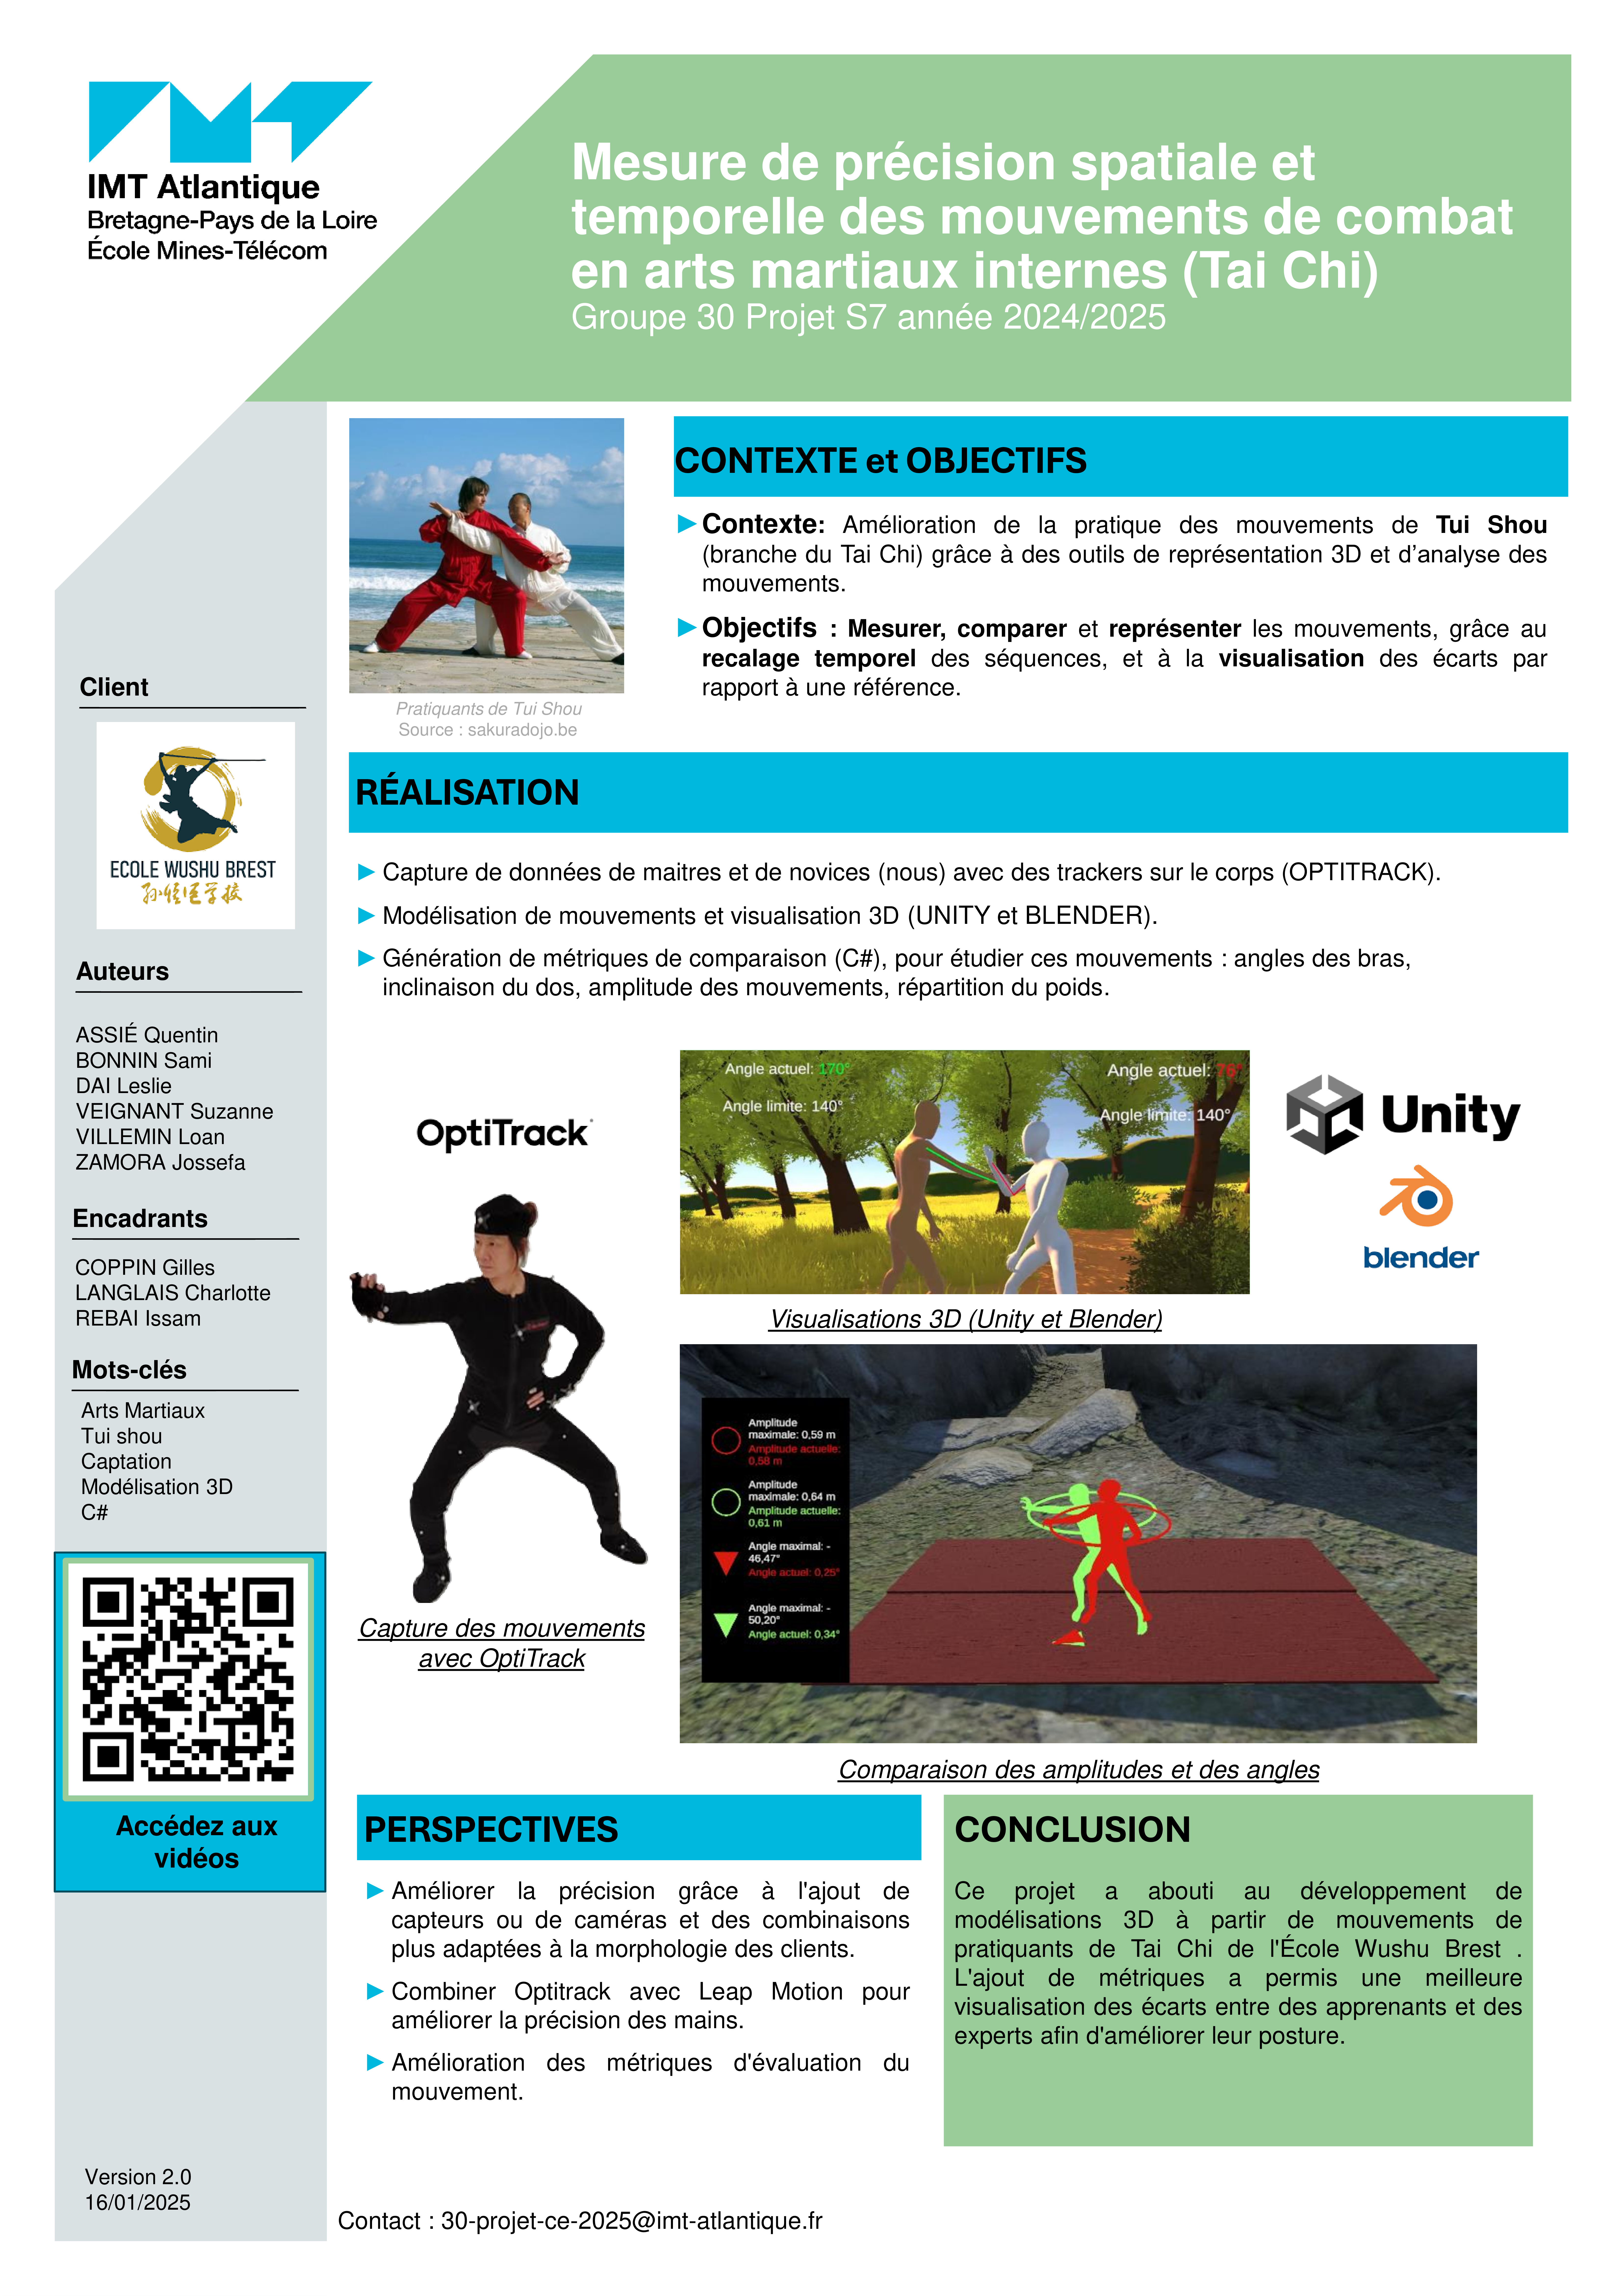
Here is the poster we presented at the forum.
The team
Our team brought together a variety of profiles from different specialisations. I specialised in collaborative software development, while other members specialised in networks, virtual reality, data and project management. This diversity allowed us to share out the roles efficiently and to make the most of our complementary skills.
Each member had two roles: a technical role and a project management role. For example, I was both the note-taker in meetings and the Unity specialist for development and data analysis.
Beyond the technical side, this project introduced us to tai chi and Tuishou, enriching our experience both intellectually and personally.
Project management
Needs analysis
The first step was to talk with the École Wushu to clarify their expectations.
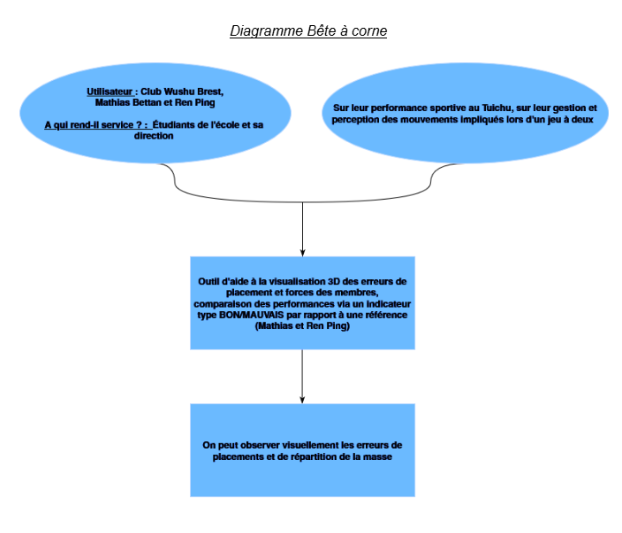
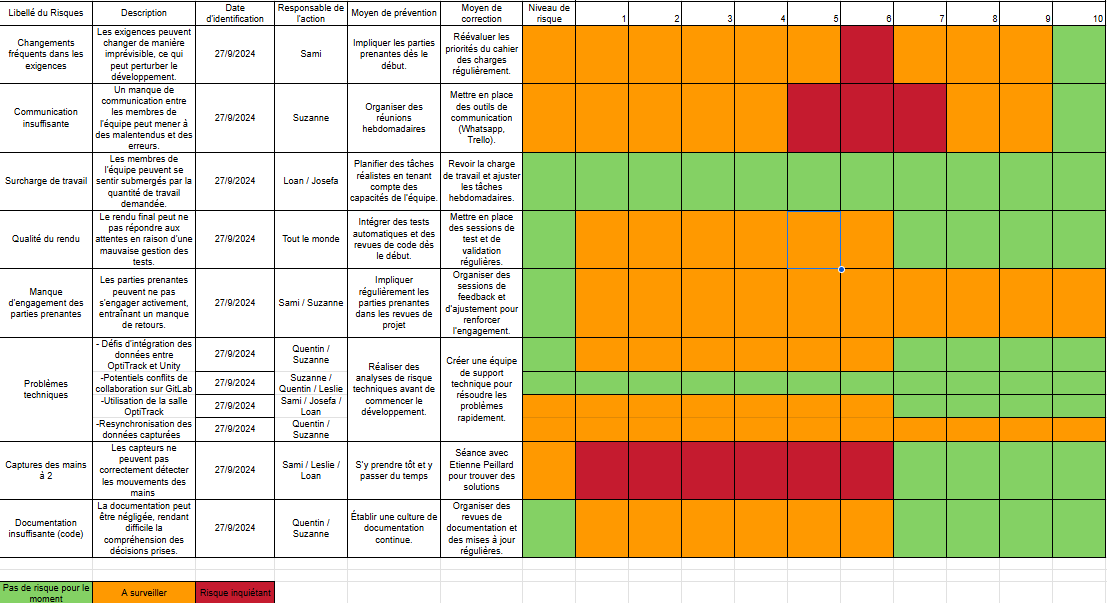
We reformulated the initial need, set SMART objectives and carried out a functional analysis and a risk analysis.
This phase gave the project a clear framework and structured our deliverables.
Organisation
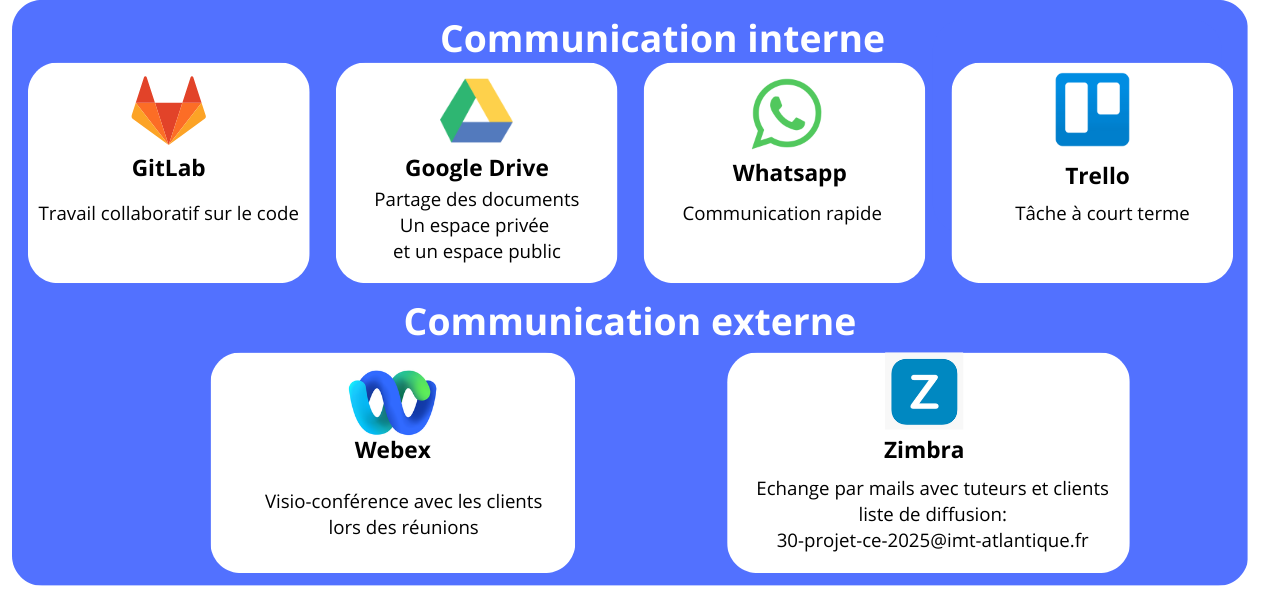
To coordinate our work, we set up several complementary tools:
- Trello for short-term task tracking
- Gantt chart and WBS for long-term planning
- Google Drive and GitLab to centralise documents and code
Internal communication went through WhatsApp and external communication through a mailing list.
This organisation helped us anticipate risks, track progress and make collaboration within the team easier.
Technical work
Getting started
We began with a review of the state of the art and of the work done by previous student cohorts.
Each member shared their knowledge through tutorials and summaries, which helped us quickly get up to speed with OptiTrack and Unity.
Internal training sessions and online self-learning completed this phase.
Data collection
Movements were captured with OptiTrack, optimising hand tracking and sensor placement.
Challenges:
- Stable hand tracking was a major challenge and took a month of work instead of the two weeks initially planned. Sensors can be hidden when partners are in contact.
- Adding more cameras could improve accuracy, but makes recalibration more complicated.
- The suits we used were sometimes too loose, which caused inaccuracies.
Analysis and visualisation
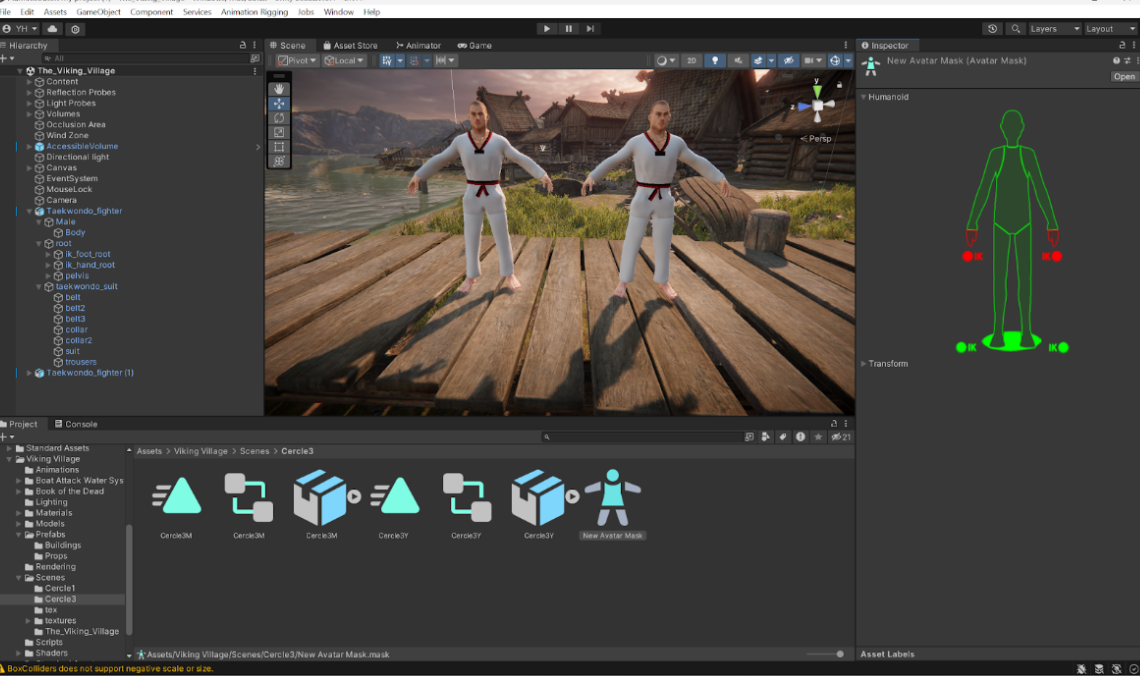
The raw data was imported into Unity after a pass through Blender to separate the models and position the avatars correctly.
Challenges:
- Separating the data of two people recorded at the same time required work in Blender before importing into Unity.
- Repositioning the avatars face to face in Unity was complex, because they were in separate folders.
- Modelling the lines (line renderers) was difficult: when they were inside the avatars, they became invisible. Options considered: making the avatars transparent or shifting the lines slightly.
- Recording videos in Unity was simple, but editing was time-consuming and required planning the capture in advance.
Example Unity script: to display the centre of gravity of the lower body in Unity, we used the following script:
using System.Collections;
using System.Collections.Generic;
using UnityEngine;

// Affiche le centre de gravité du bas du corps
public class CalculCentreGravite : MonoBehaviour
{
    [SerializeField] Transform piedGauche;
    [SerializeField] Transform piedDroit;
    [SerializeField] Transform bassin;

    [SerializeField] float massePiedGauche = 1f;
    [SerializeField] float massePiedDroit = 1f;
    [SerializeField] float masseBassin = 3f;

    [SerializeField] LineRenderer lineRenderer;

    private Vector3 centreGravite;

    void Start()
    {
        if (lineRenderer != null)
        {
            lineRenderer.positionCount = 2;
            lineRenderer.startWidth = 0.5f;
            lineRenderer.endWidth = 0.5f;
            lineRenderer.material = new Material(Shader.Find("Unlit/Color"));
            lineRenderer.startColor = new Color(1f, 1f, 0f);
            lineRenderer.endColor = new Color(1f, 1f, 0f);
        }
    }

    void Update()
    {
        centreGravite = CalculerCentreGravite();

        if (lineRenderer != null)
        {
            lineRenderer.SetPosition(0, centreGravite);
            lineRenderer.SetPosition(1, centreGravite + Vector3.up * 0.5f);
        }

        Debug.Log("Centre de Gravité: " + centreGravite);
    }

    Vector3 CalculerCentreGravite()
    {
        float masseTotale = massePiedGauche + massePiedDroit + masseBassin;
        Vector3 centre = (piedGauche.position * massePiedGauche +
                          piedDroit.position * massePiedDroit +
                          bassin.position * masseBassin) / masseTotale;
        return centre;
    }
}
Results
The project produced:
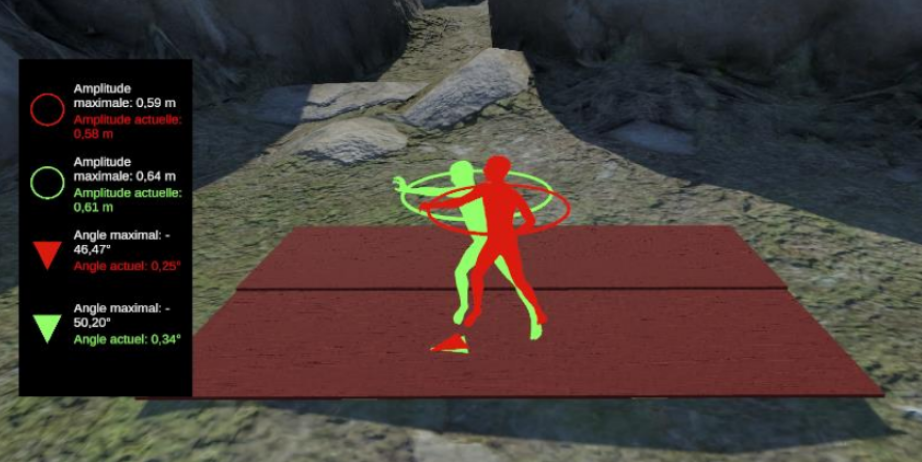
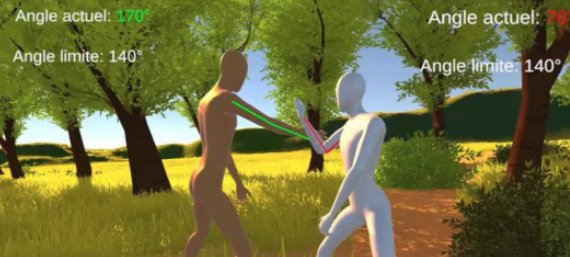
- A reproducible method for analysing Tuishou movements
- Dynamic visualisations highlighting the differences between expert and beginner
- A demonstration video approved by the École Wushu
Areas for improvement
We identified several areas for the next teams taking over the project:
- Go further in analysing movement accuracy
- Focus more on metrics than on hand capture
- Start with a simplified model before including two people at the same time
These suggestions should save time and improve the quality of future analyses.